
Swing trading is a popular trading strategy that involves holding stocks for a few days to weeks to capitalize on short- to medium-term price movements. To succeed in swing trading, traders rely heavily on technical analysis and advanced charting tools. Upstox, one of India’s leading discount brokers, offers a powerful suite of charting tools that help traders analyze trends, identify trade setups, and make informed decisions. In this article, we will explore how to use Upstox’s advanced charting tools for swing trading effectively.
Understanding Swing Trading and Its Importance
Swing trading focuses on capturing short-term price swings in the stock market. Unlike intraday trading, where positions are squared off within the same day, swing traders hold positions for several days or weeks, depending on market conditions. The key elements of swing trading include:
- Identifying Trends: Swing traders use technical analysis to determine whether a stock is in an uptrend, downtrend, or consolidation phase.
- Using Indicators: Various indicators help in predicting potential price movements.
- Managing Risks: Stop-loss and target levels are crucial for risk management in swing trading.
Getting Started with Upstox Advanced Charting Tools
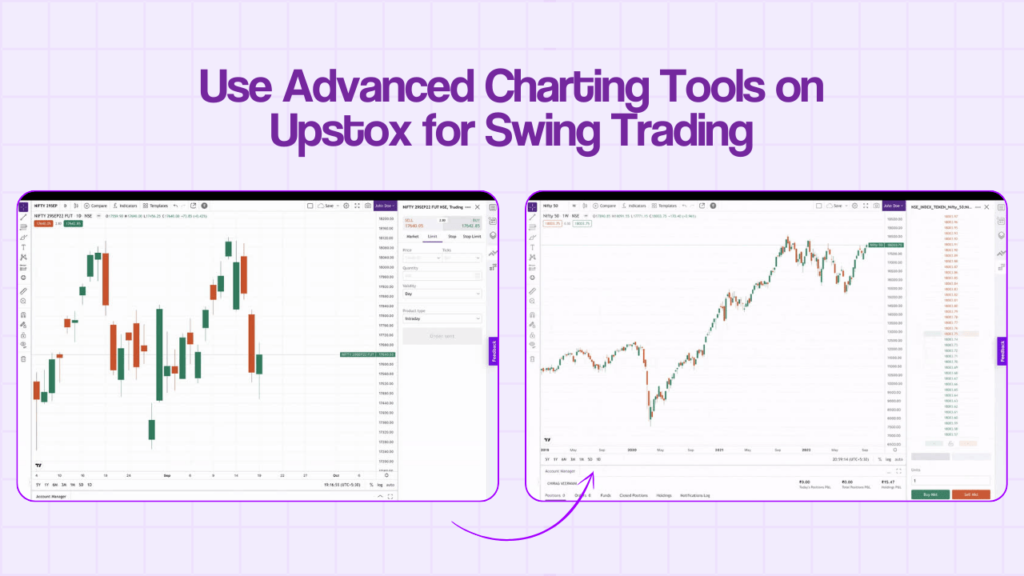
Upstox provides traders with state-of-the-art charting tools to analyze price movements effectively. Here’s how you can access and use these tools:
a. Accessing Charts on Upstox
- Log in to your Upstox account via the web platform or mobile app.
- Search for the stock or index you want to analyze.
- Click on the ‘Charts’ tab to open an interactive price chart.
- Customize the chart type (candlestick, line, bar, or Heikin-Ashi) based on your preference.
b. Choosing the Right Timeframe
- For short-term swing trading, use 15-minute, 1-hour, or daily charts.
- For medium-term swing trading, use daily or weekly charts to analyze trends.
- Multiple time frame analysis: A combination of different time frames gives a clearer picture of price trends.
Key Charting Tools for Swing Trading
a. Candlestick Patterns
Candlestick charts provide valuable insights into price action. Some crucial patterns for swing traders include:
- Bullish Engulfing: Signals a potential uptrend.
- Bearish Engulfing: Indicates a possible downtrend.
- Doji: Represents indecision and a potential reversal.
- Hammer & Hanging Man: Suggests trend reversal points.
b. Trendlines and Support/Resistance Levels
Drawing trendlines helps in identifying trend direction and potential entry or exit points.
- Support Levels: Price zones where buying interest is strong.
- Resistance Levels: Price zones where selling pressure increases.
- Breakout & Breakdown: When the price breaks through support or resistance, it signals a continuation or reversal of trends.
c. Moving Averages
Moving averages help smooth out price fluctuations and identify trends.
- Simple Moving Average (SMA): Commonly used periods are 20, 50, and 200 days.
- Exponential Moving Average (EMA): Reacts faster to price changes and is ideal for swing traders.
- Golden Cross & Death Cross: The 50-day SMA crossing above the 200-day SMA signals a bullish trend, whereas the reverse signals a bearish trend.
d. RSI (Relative Strength Index)
The RSI measures momentum and identifies overbought and oversold conditions.
- Above 70: Stock is overbought and may be correct.
- Below 30: Stock is oversold and may bounce back.
- Divergence: When the RSI moves opposite price, it indicates a potential trend reversal.
e. MACD (Moving Average Convergence Divergence)
MACD helps in identifying trend direction and momentum shifts.
- MACD Line Crossing Above Signal Line: Indicates a bullish trend.
- MACD Line Crossing Below Signal Line: Indicates a bearish trend.
- Zero Line Crossovers: Confirms trend strength.
f. Bollinger Bands
Bollinger Bands measures price volatility.
- Price Touching Upper Band: Indicates overbought conditions.
- Price Touching Lower Band: Indicates oversold conditions.
- Squeeze: A tight band formation suggests upcoming volatility.
Using Charting Tools to Identify Swing Trading Opportunities
a. Spotting Trend Reversals
Using a combination of RSI, MACD, and candlestick patterns helps in identifying trend reversals.
b. Breakout Trading Strategy
Look for stocks breaking above resistance with strong volume to catch a breakout trade.
c. Pullback Strategy
After a strong uptrend, stocks often pull back to support levels before resuming their move. Identifying pullbacks helps traders enter at better prices.
Risk Management for Swing Trading
Risk management is key to successful swing trading. Here’s how you can protect your capital:
- Use Stop-Loss Orders: Place stop-loss orders below recent support levels to limit losses.
- Define Risk-Reward Ratio: Aim for at least a 1:2 or 1:3 risk-reward ratio.
- Avoid Overleveraging: Use capital wisely to avoid excessive risk exposure.
- Diversify Trades: Spread risk across multiple trades rather than betting on a single stock.
Benefits of Using Upstox for Swing Trading
Upstox offers several advantages that make swing trading easier and more efficient:
- User-Friendly Interface: Intuitive charting tools for quick analysis.
- Fast Order Execution: Ensures minimal slippage.
- Customizable Alerts: Set price alerts for important levels.
- Integration with Trading APIs: For algorithmic and automated strategies.
- Low Brokerage Fees: Maximizes profits with minimal costs.
Final Thought
Swing trading requires a combination of technical analysis, strategic planning, and risk management. Upstox provides advanced charting tools that empower traders to analyze price action effectively and make well-informed decisions. By mastering key indicators, understanding price movements, and implementing solid risk management strategies, traders can maximize their chances of success in swing trading. Whether you are a beginner or an experienced trader, leveraging Upstox’s powerful charting tools can help you gain a competitive edge in the stock market. Start using these advanced tools today and take your swing trading to the next level!